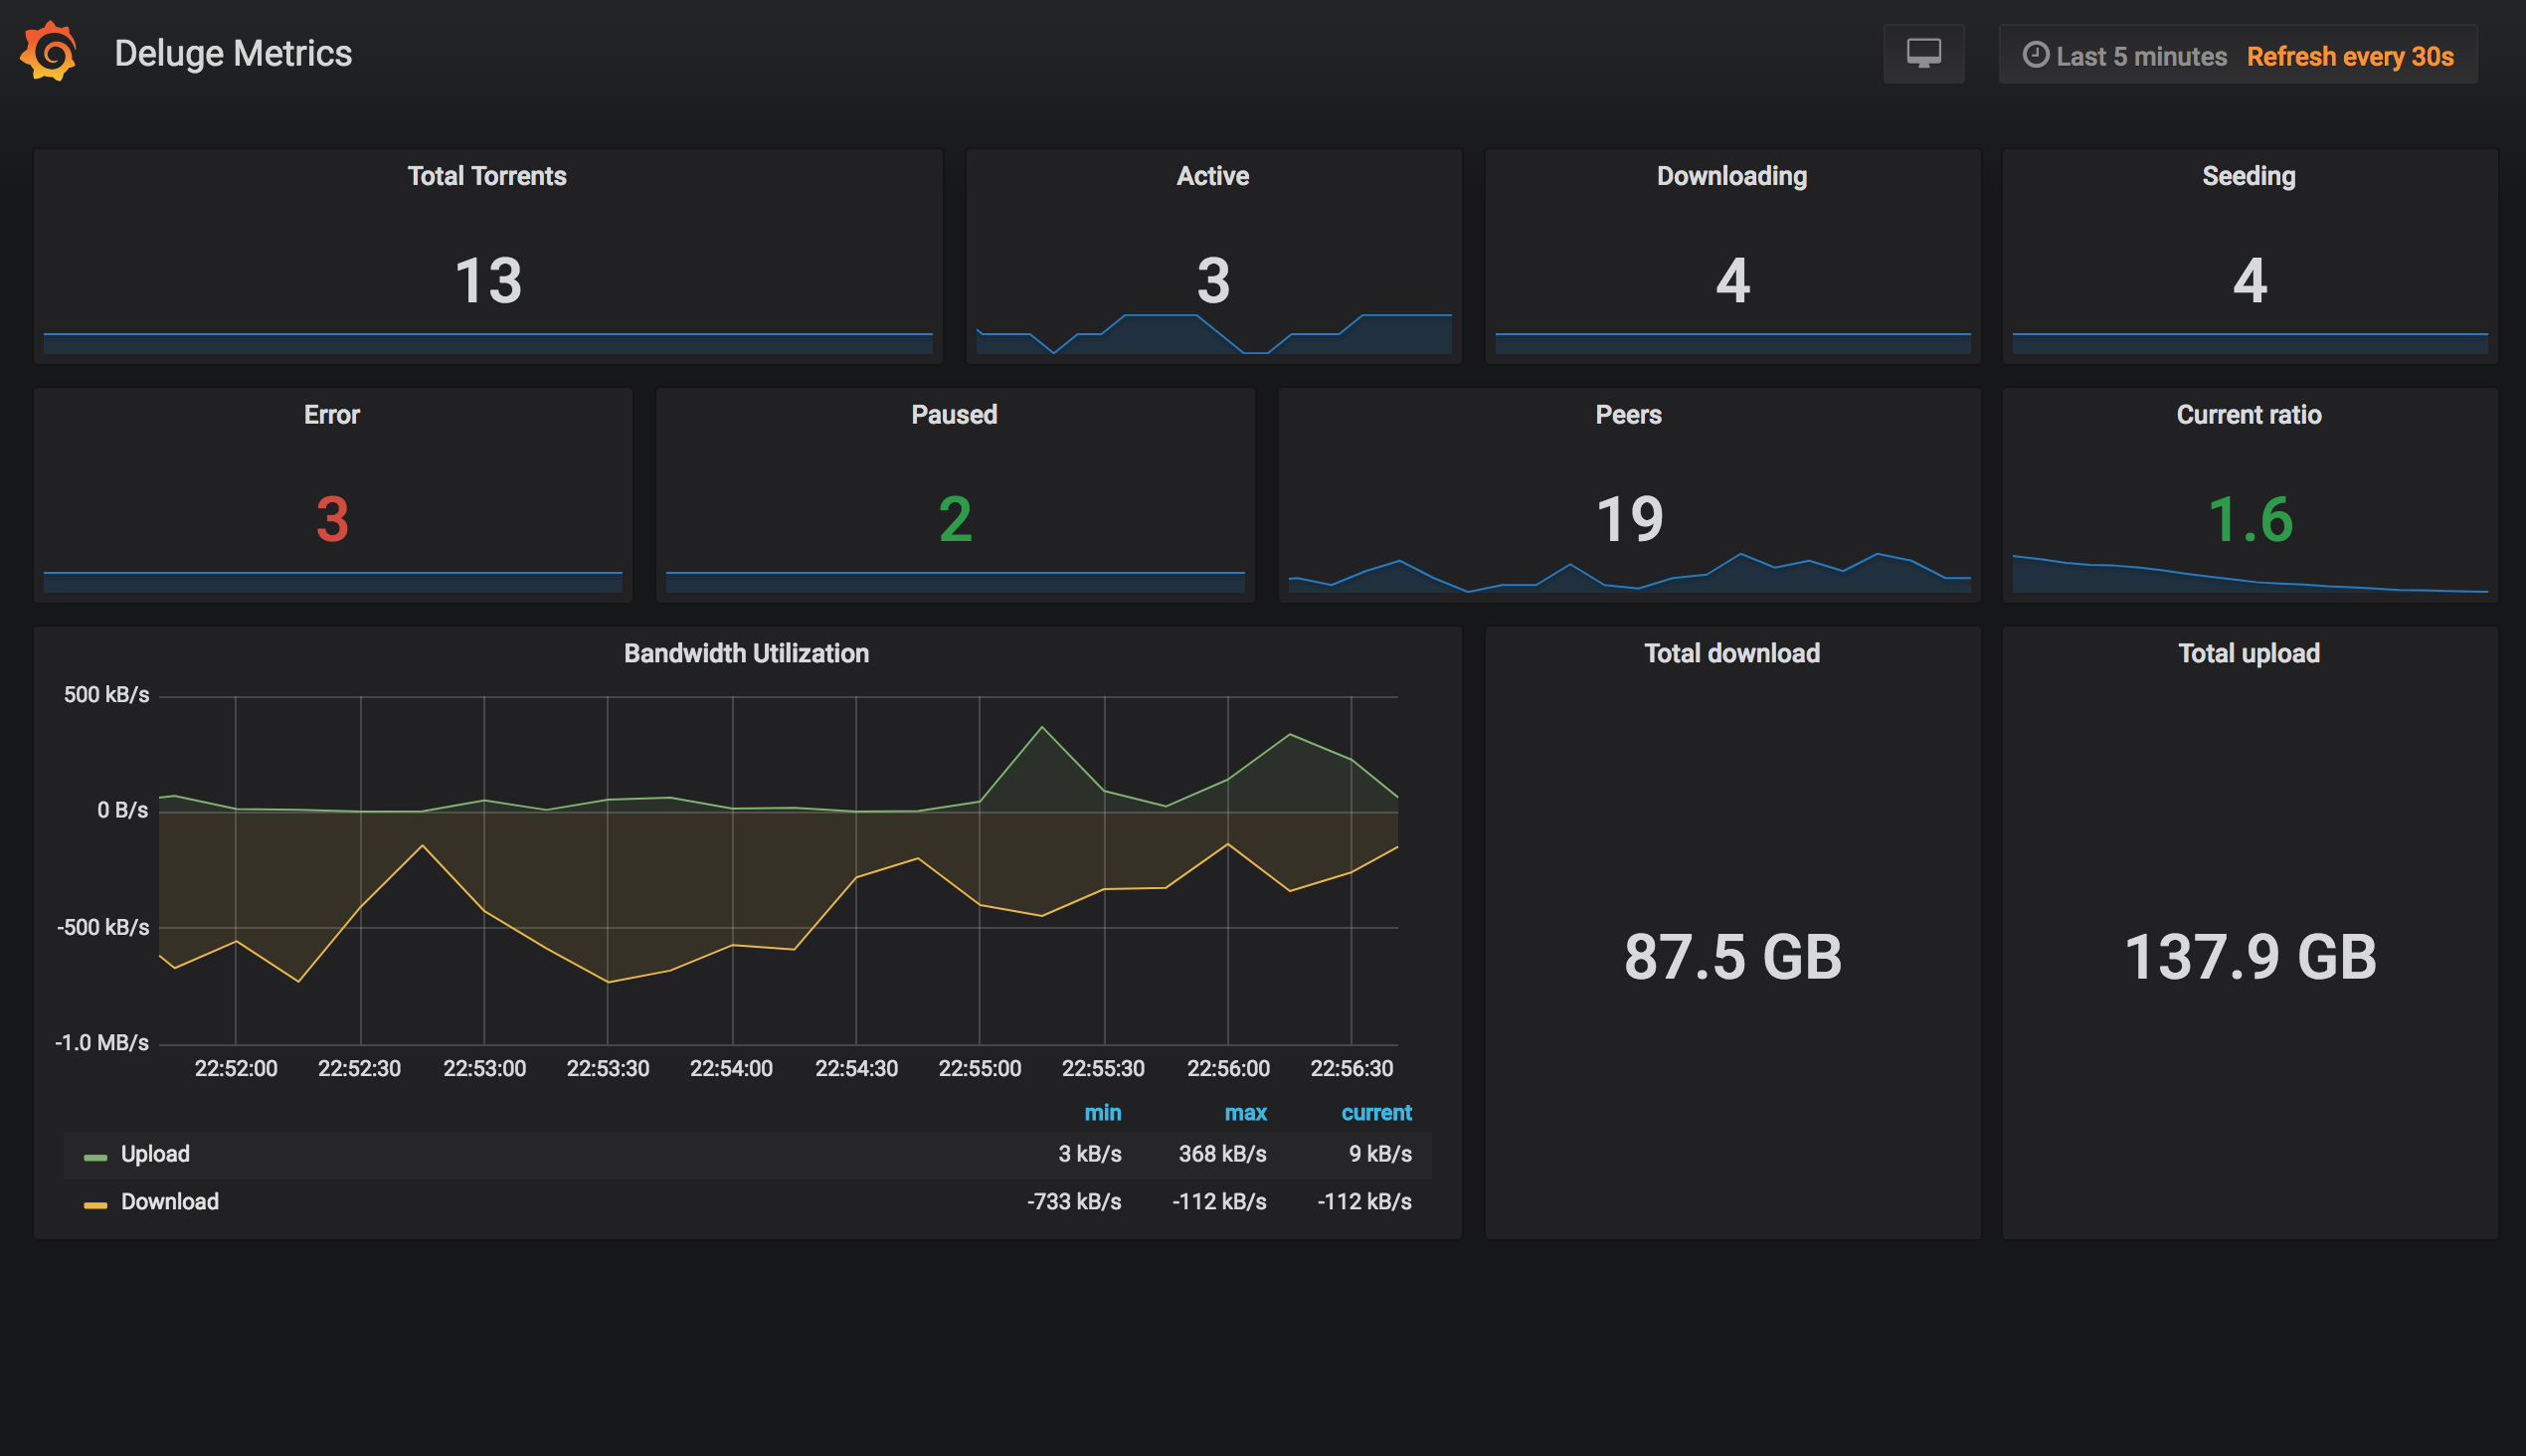
Tonight I was introduced to a Deluge exporter for Prometheus so I figured I’d whip up a quick dashboard for visualizing the metrics.
Deluge Dashboard is a very simple way to display Deluge torrent metrics. It uses the deluge exporter to populate a Prometheus data source. The panels in this dashboard can be copied into more comprehensive dashboards for a single pane of glass view of your network transfers or it can be used as a standalone glanceboard.
If you run a pihole the odds are good that you’ve needed to disable it from time to time. I wanted an easy way to disable my pihole(s) temporarily, so I wrote a simple shell script to do it for me. I’m almost always on my Macbook, so this approach worked for a while. I needed to disable it a few times while I was out of the room, so I figured I’d find an easier way to do it from my phone.
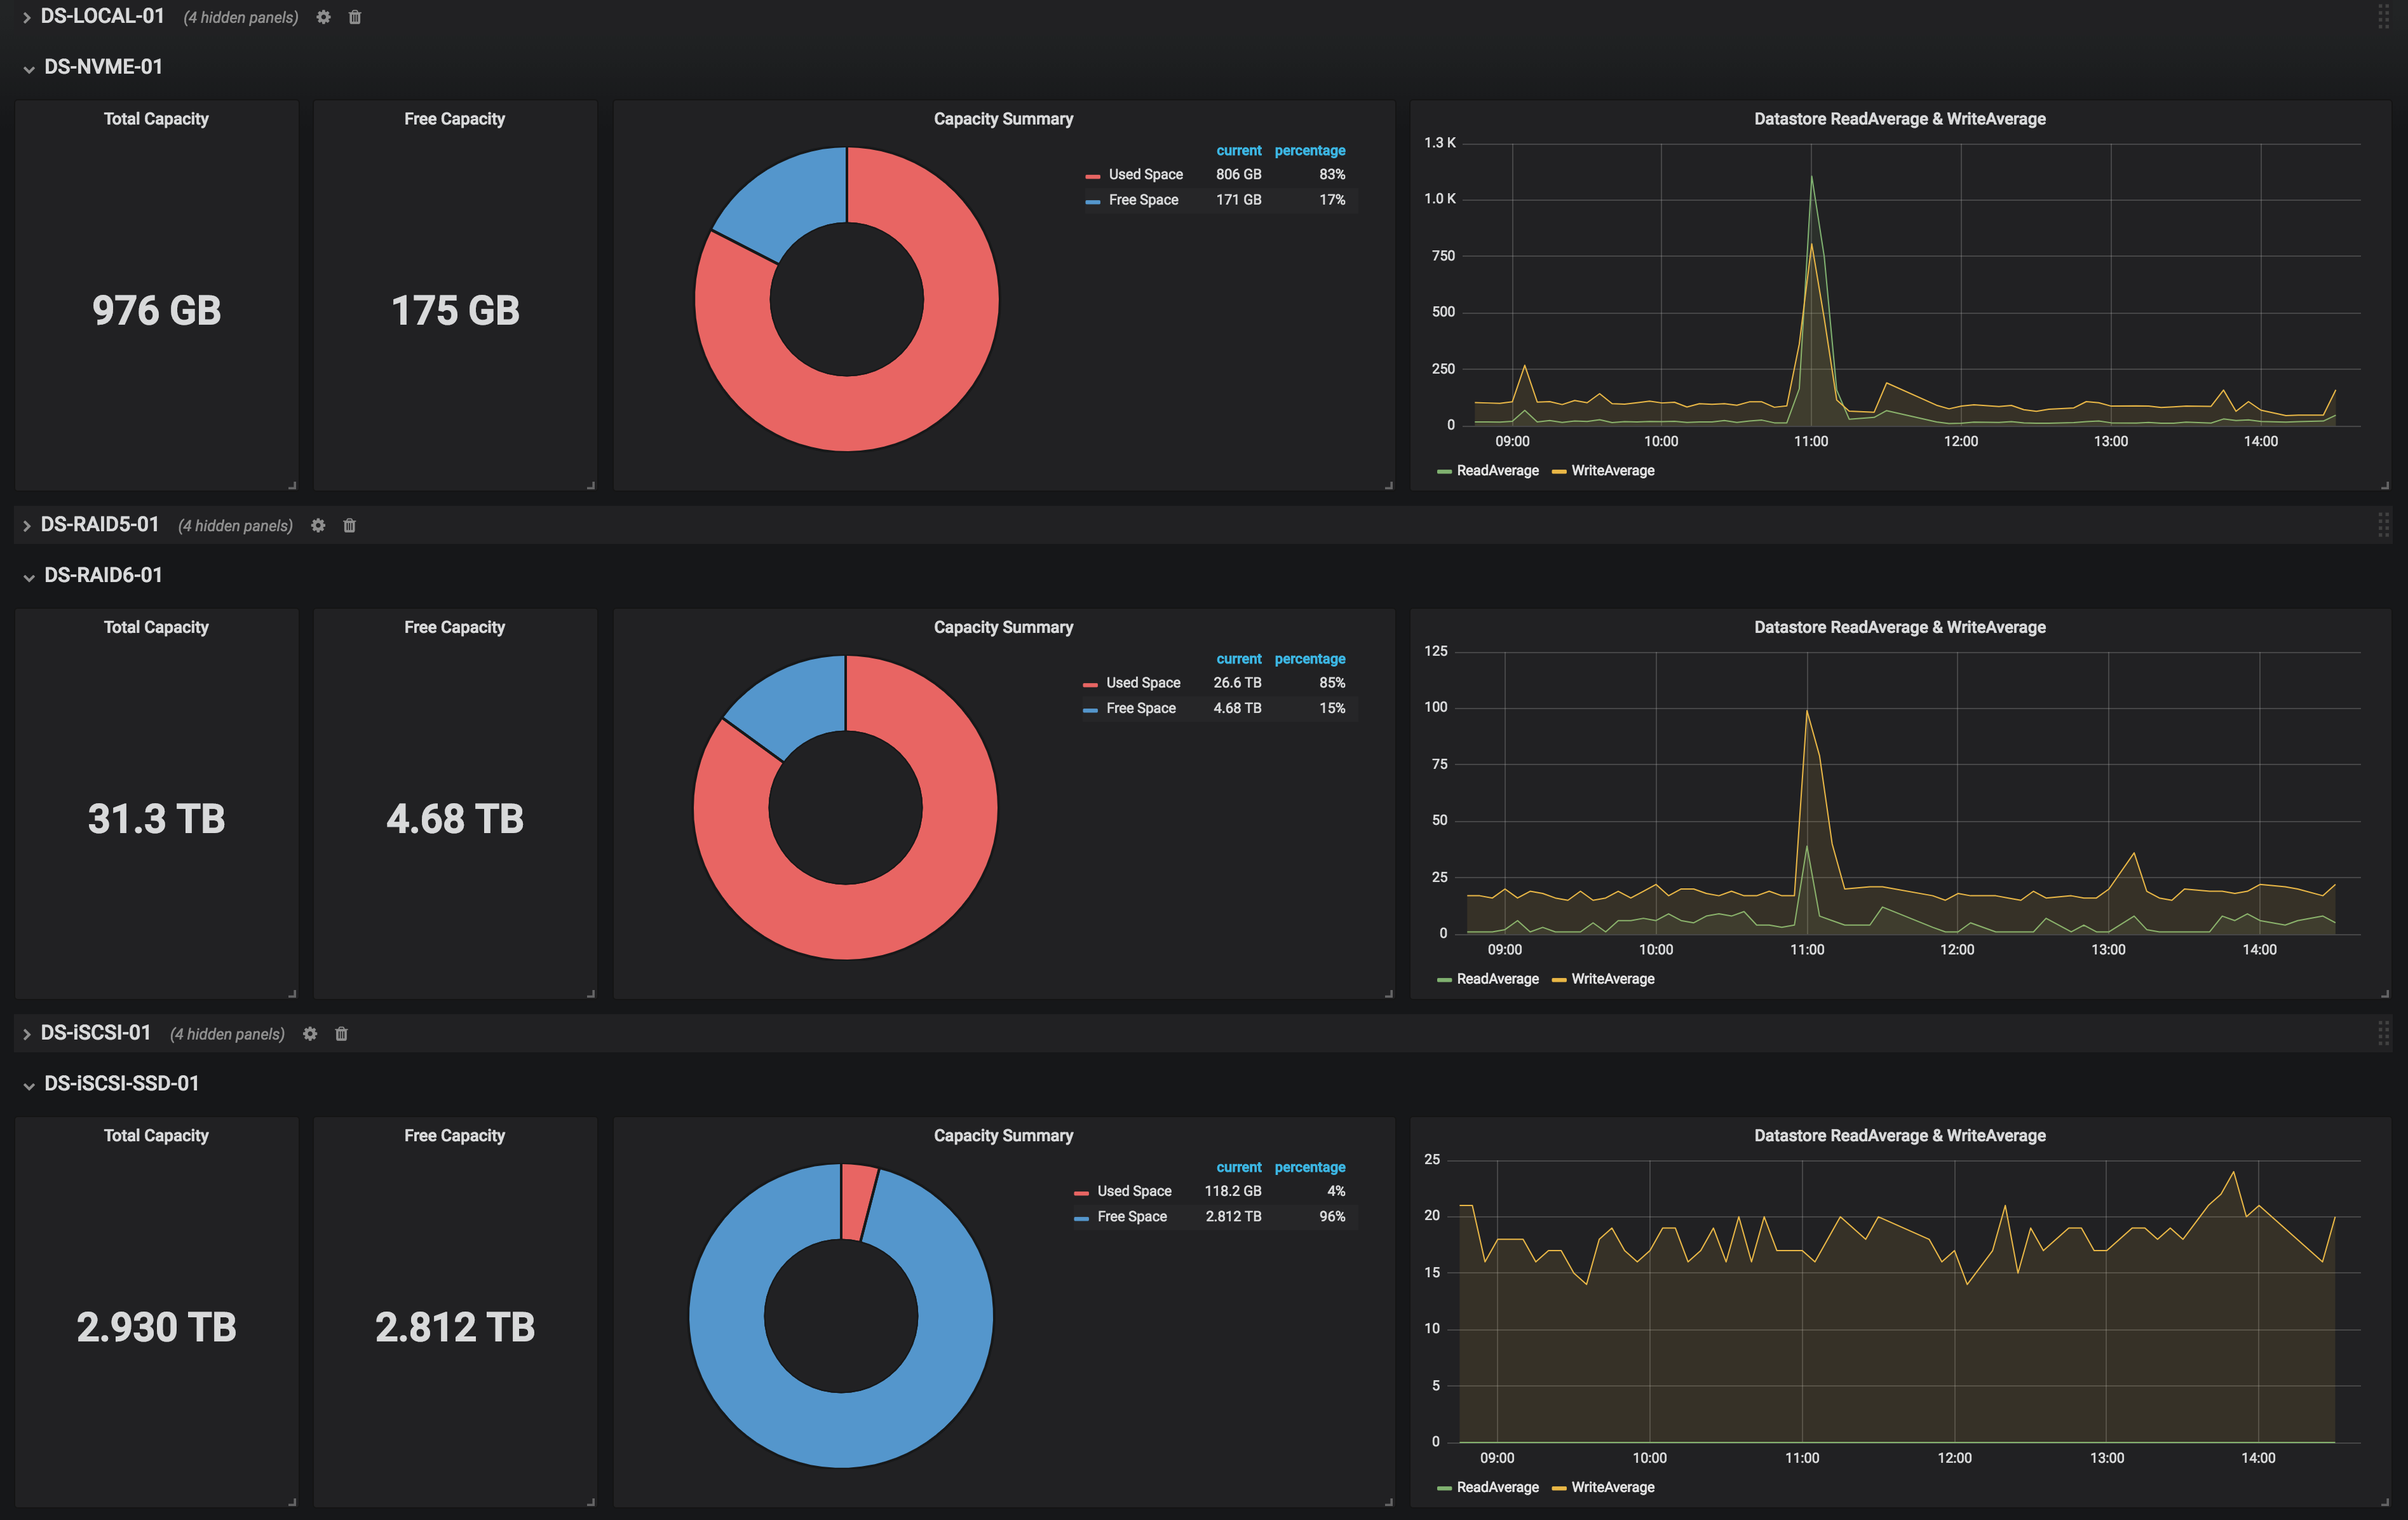
Grafana is a really great tool for visualizing data. In my homelab, I have obviously have a lot of data so what better than to use than the right tool for the job. Below, you can find some screenshots of my dashboards. I use a raspberry pi that just runs a full screen browser for viewing the dashboard slideshow in addition to a few other glance boards (DAKBoard, Monitorr, et al).
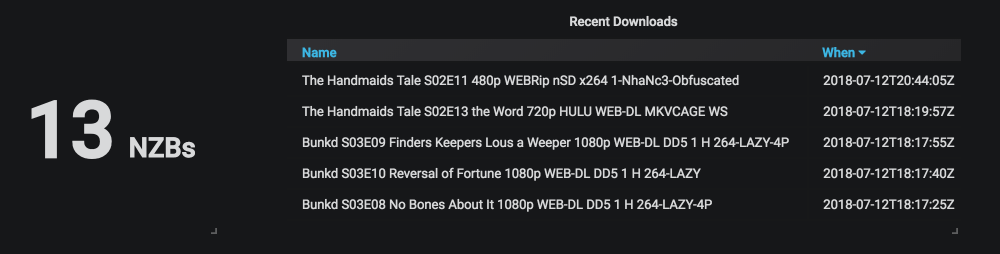
I made a Grafana Dashboard for my Plex system at home. I feed various system telemetry into an influx database as the data source and Plex-Data-Collector for inserting the data from plex. Additionally, I wrote a python script for injecting logs from NZBGet into mysql. I then use Grafana to display the graphs. I really love Grafana and I’ve created several dashboards:
As part of my dashboard project (link coming soon) I was looking for a lightweight self hosted monitoring solution for my home network services. I found Monitorr and decided it was a perfect fit for my needs. It’s simple and it doesn’t have any frills, which is exactly what I wanted.
Update: 2018/09/13 pfSense has a plugin for telegraf which can be installed from the gui. I recommend this method rather than what I figured out below. I’m leaving these notes for manual installation reference.
2017/12/09 I put this guide together using information from various other blogs. This is current as of December 2017 and using pfSense 2.4.2. For this tutorial, you’ll need your IP or hostname of your influxdb data source and your username and password.
I wrote a simple plugin for NZBGet that inserts download history into a MySQL database. Having my download list in a database makes operations on the data easier than groking text logs.
I wanted to display my most recent downloads on a Grafana Dashboard:
To use simply copy the Mysql-Log.py script into your NZBGet/scripts directory. In NZBGet, select settings and set the hostname of your MySQL instance.
I couldn’t find any quick references about accessing the Pihole API so I created this page.
Pihole is a great app for blocking internet advertising that was originally designed to be run on a raspberry pi. It blocks known advertisers’ domains at the DNS level by effectively null routing requests destined to serve ads. It can be run on VMs, Raspberry Pis and bare metal servers.
Here are the steps to access the pihole’s rest api. I’m using curl in this example, but you can integrate it with OpenHAB or any other system that can talk REST.
Step 1: Obtaining the web password
Most of the useful API endpoints the pihole provides wisely require authentication. After searching around the net I found that I could pass &token=A_VALID_SESSION_TOKEN to authenticate to the pihole for a session. Unfortunately, this is a temporary auth token and wasn’t suitable for my needs. After more digging, I found the gem I needed: &auth=WEBPASSWORD. Sounds great, but where do I obtain this password? You simply log onto your pihole instance or server and run:
I wrote a simple plugin for NZBGet that inserts download history into an ElasticSearch cluster (or node). It uses API calls rather than parsing filesystem logs. I wanted a quick way to just insert the data so I created this script.
Simply copy the ESLog.py script into your NZBGet/scripts directory. In NZBGet, select settings and set the hostname of your ElasticSearch instance.