A Dashboard for Pihole Stats
Pihole + Grafana + InfluxDB Dashboard
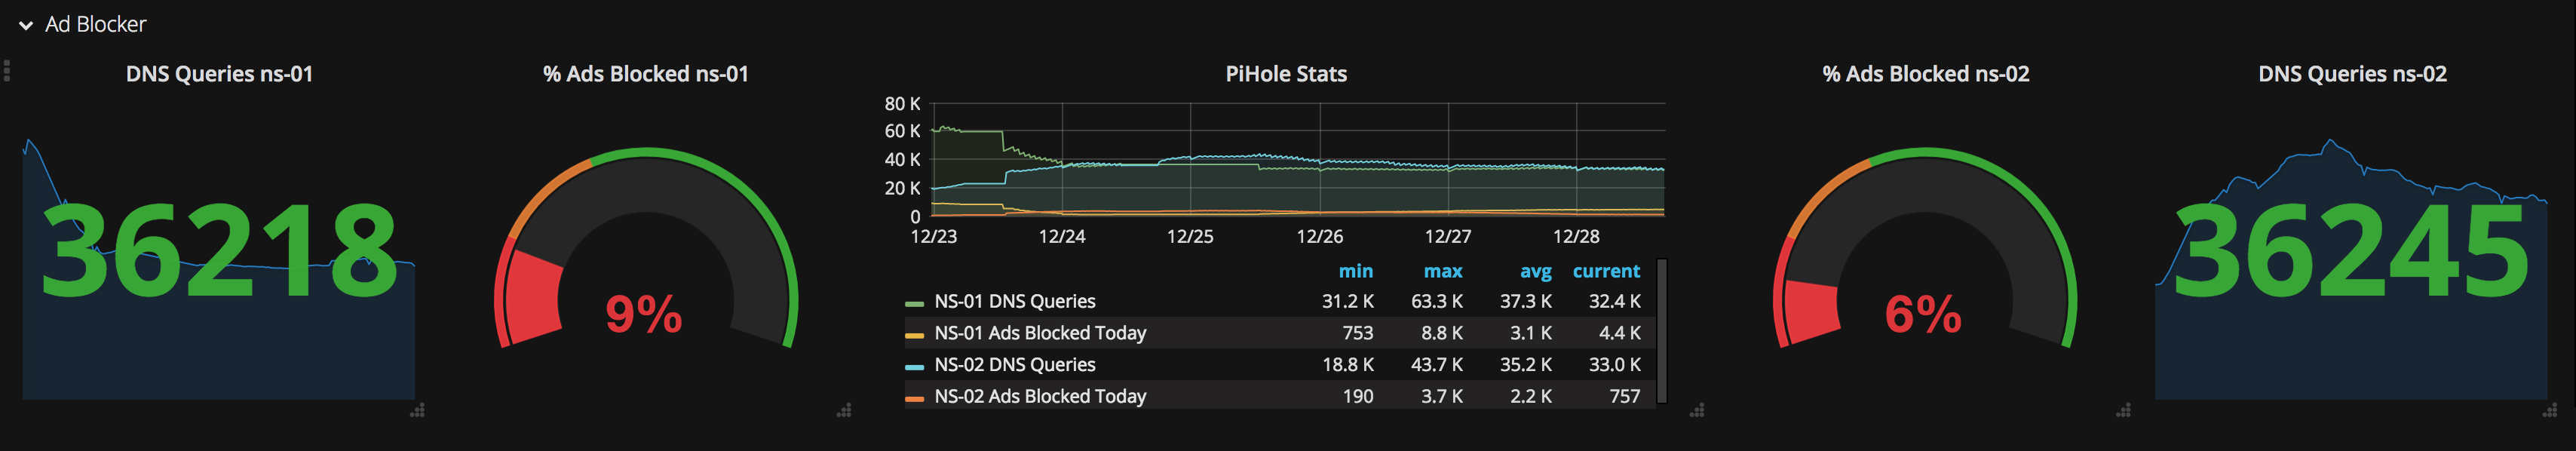
I wanted to add the metrics from my ad-blocker, the great Pihole to my executive dashboard. To create the dashboard I used Grafana to display the graphs and InfluxDB a the time-series backend database. I use a simple python script to get the metrics from pihole and record them in influxdb.
Grafana makes it easy to render them into a user friendly dashboard.
Installing Grafana and Influxdb is beyond the scope of this blog post but here is the scipt that I use to get the data from pihole and insert it into Influx.
After you’re getting data in your influx db you’ll have to create a grafana dashboard.
An overview of the steps:
- Install Grafana
- Create a Datasource - in Grafana, type InfluxDB
- Create a Dashboard - Name it whatever you want
- Add a ROW to your Dashboard - Give it a name if you want (optional)
- Add some panels - In the example (above) I used Singlestat, Gauge, Graph, Gauge and Singlestat
The values I used for the graph panel:

This is just a general overview. You’ll obviously have to customize this for your environment / requirements which is left an exercise for the reader.
| Technology Used: | ||
|---|---|---|
 |  |
A Dashboard for Pihole Stats


