If you run a pihole the odds are good that you’ve needed to disable it from time to time. I wanted an easy way to disable my pihole(s) temporarily, so I wrote a simple shell script to do it for me. I’m almost always on my Macbook, so this approach worked for a while. I needed to disable it a few times while I was out of the room, so I figured I’d find an easier way to do it from my phone.
I couldn’t find any quick references about accessing the Pihole API so I created this page.
Pihole is a great app for blocking internet advertising that was originally designed to be run on a raspberry pi. It blocks known advertisers’ domains at the DNS level by effectively null routing requests destined to serve ads. It can be run on VMs, Raspberry Pis and bare metal servers.
Here are the steps to access the pihole’s rest api. I’m using curl in this example, but you can integrate it with OpenHAB or any other system that can talk REST.
Step 1: Obtaining the web password
Most of the useful API endpoints the pihole provides wisely require authentication. After searching around the net I found that I could pass &token=A_VALID_SESSION_TOKEN to authenticate to the pihole for a session. Unfortunately, this is a temporary auth token and wasn’t suitable for my needs. After more digging, I found the gem I needed: &auth=WEBPASSWORD. Sounds great, but where do I obtain this password? You simply log onto your pihole instance or server and run:
I wrote a very simple little playbook for updating my local DNS records for my piholes. For me it’s easier than manually sshing onto each node and editing a file and restarting the service. Here’s the playbook:
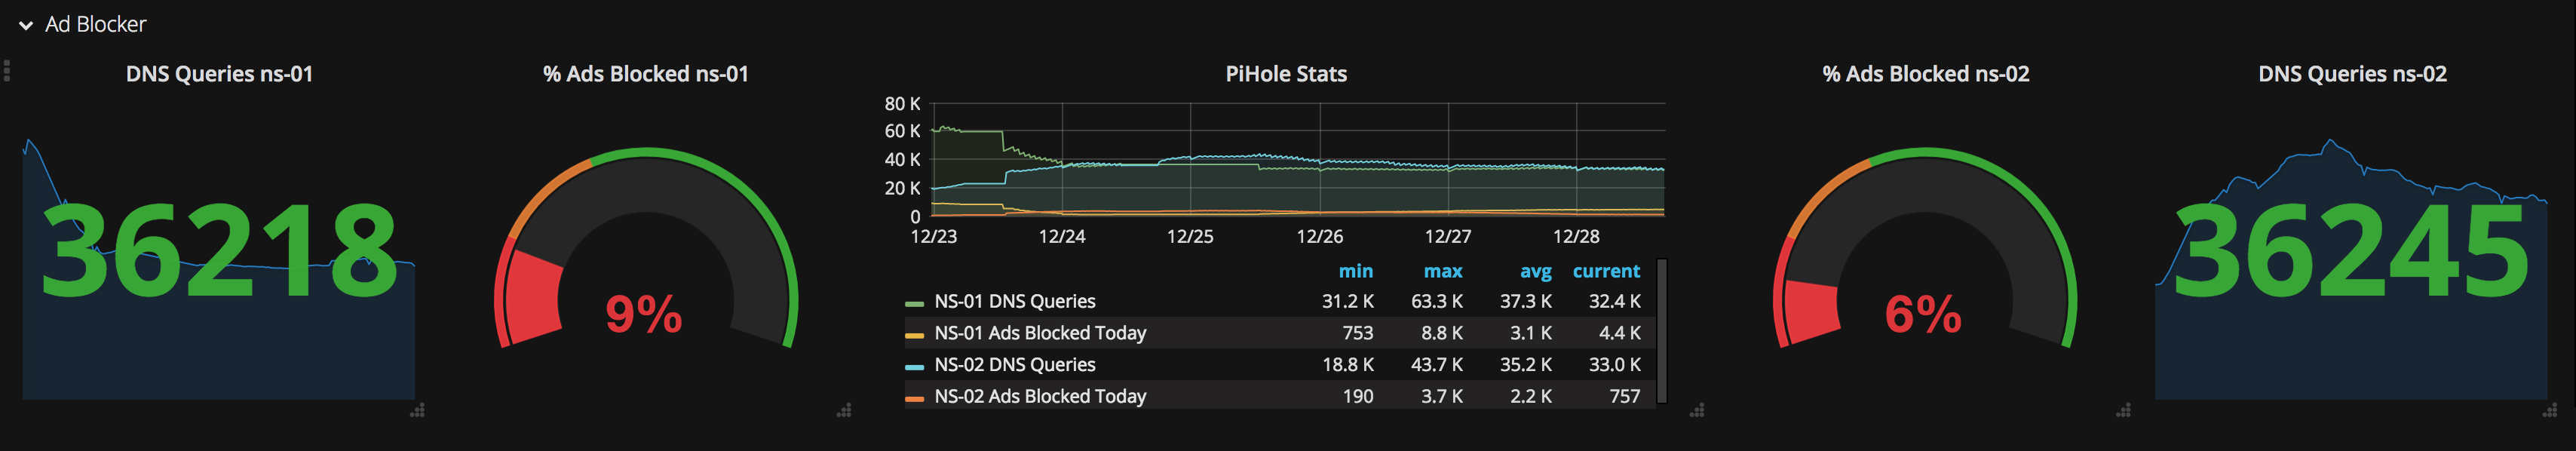
I wanted to add the metrics from my ad-blocker, the great Pihole to my executive dashboard. To create the dashboard I used Grafana to display the graphs and InfluxDB a the time-series backend database. I use a simple python script to get the metrics from pihole and record them in influxdb. Grafana makes it easy to render them into a user friendly dashboard.
Installing Grafana and Influxdb is beyond the scope of this blog post but here is the scipt that I use to get the data from pihole and insert it into Influx.
After you’re getting data in your influx db you’ll have to create a grafana dashboard.