Building an executive dashboard with Grafana
Grafana + InfluxDB + scripts = Awesome
I have many interests and some of them have metrics that are useful or fun to watch. For example, I have investment in Bitcoin so it’s nice to be able to keep an eye on it periodically.
I decided to create a graphical “at a glance” dashboard for myself. I chose Grafana as the user interface / front end and InfluxDB a the time-series backend database to store the metrics. I use various scripts and applets to populate the data into Influx and Grafana makes it easy to
render them into a user friendly dashboard.
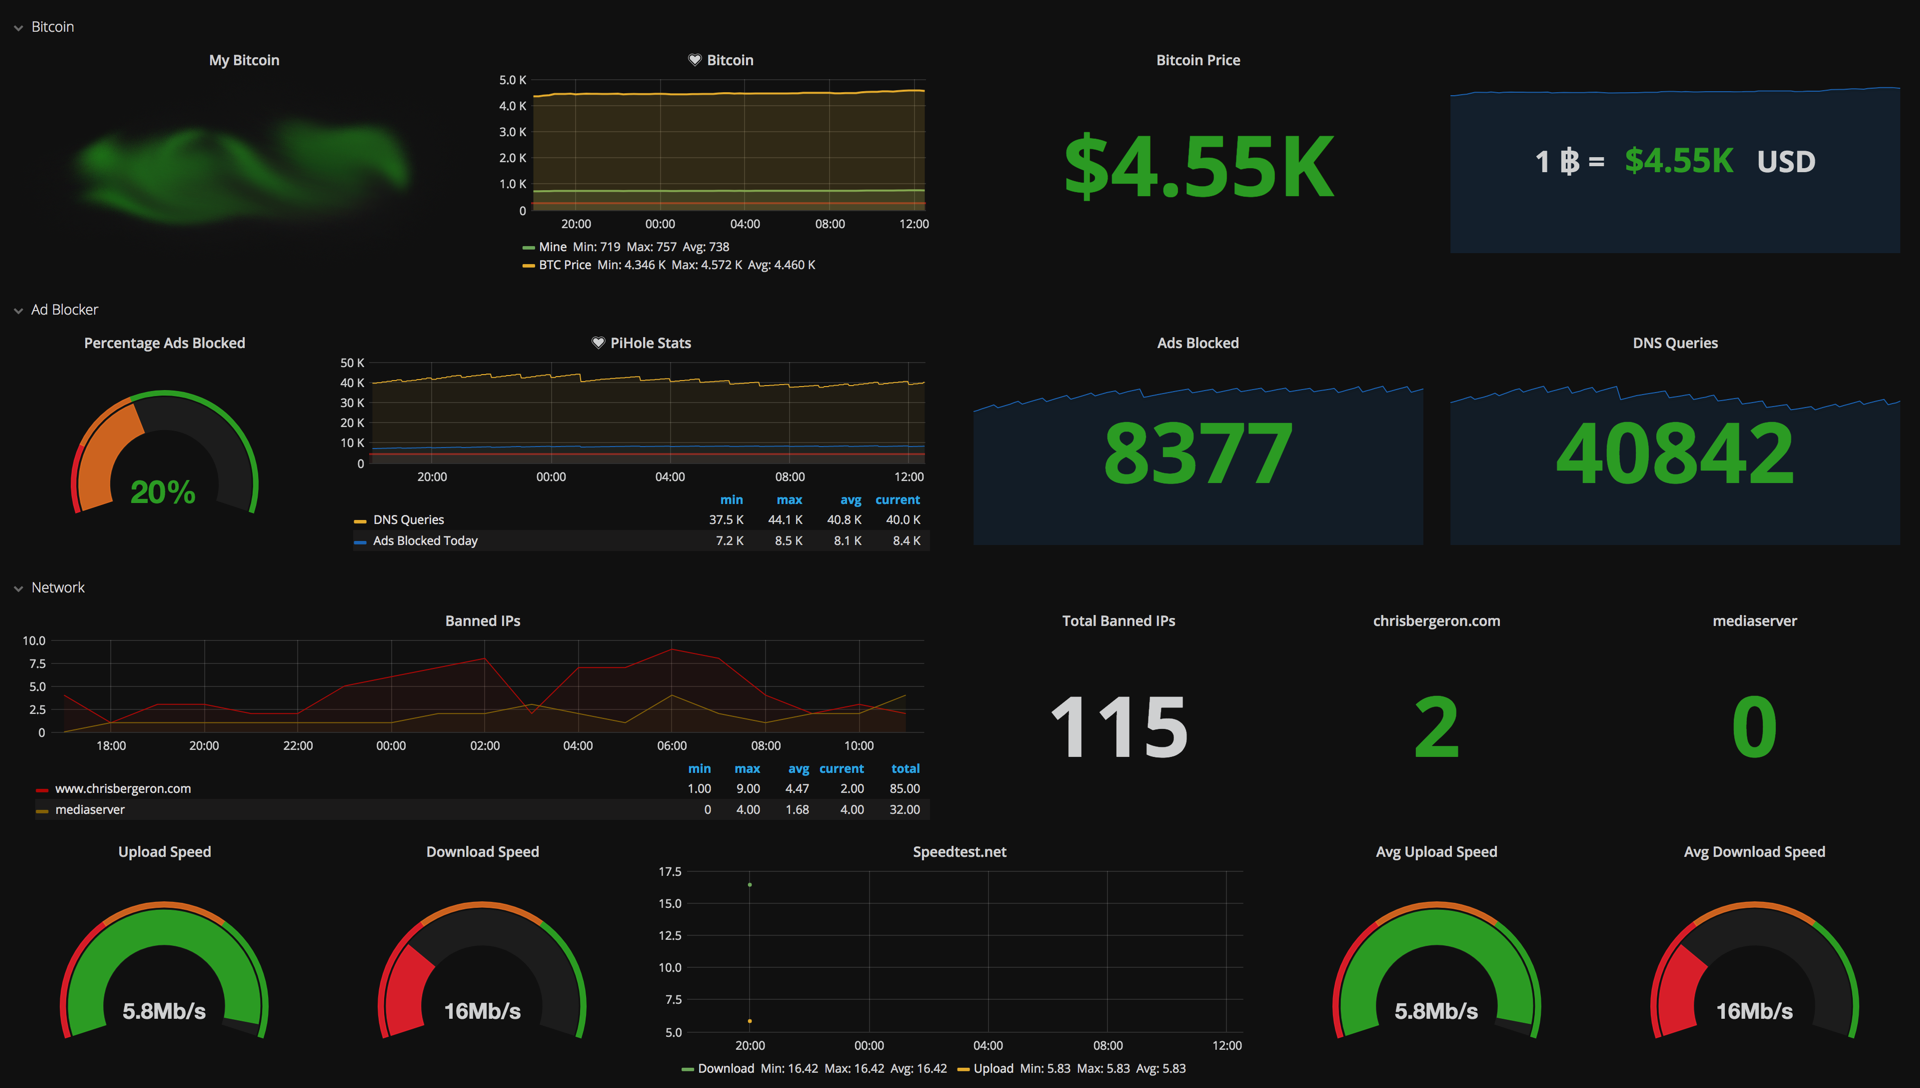
Some of the metrics I monitor are Pihole stats, the price of bitcoin, how many IPs get banned from my webservers and my network throughput.
Here’s my dashboard:
Technology used:
 |  |
Building an executive dashboard with Grafana


