Deluge Grafana Dashboard
Tonight I was introduced to a Deluge exporter for Prometheus so I figured I’d whip up a quick dashboard for visualizing the metrics.
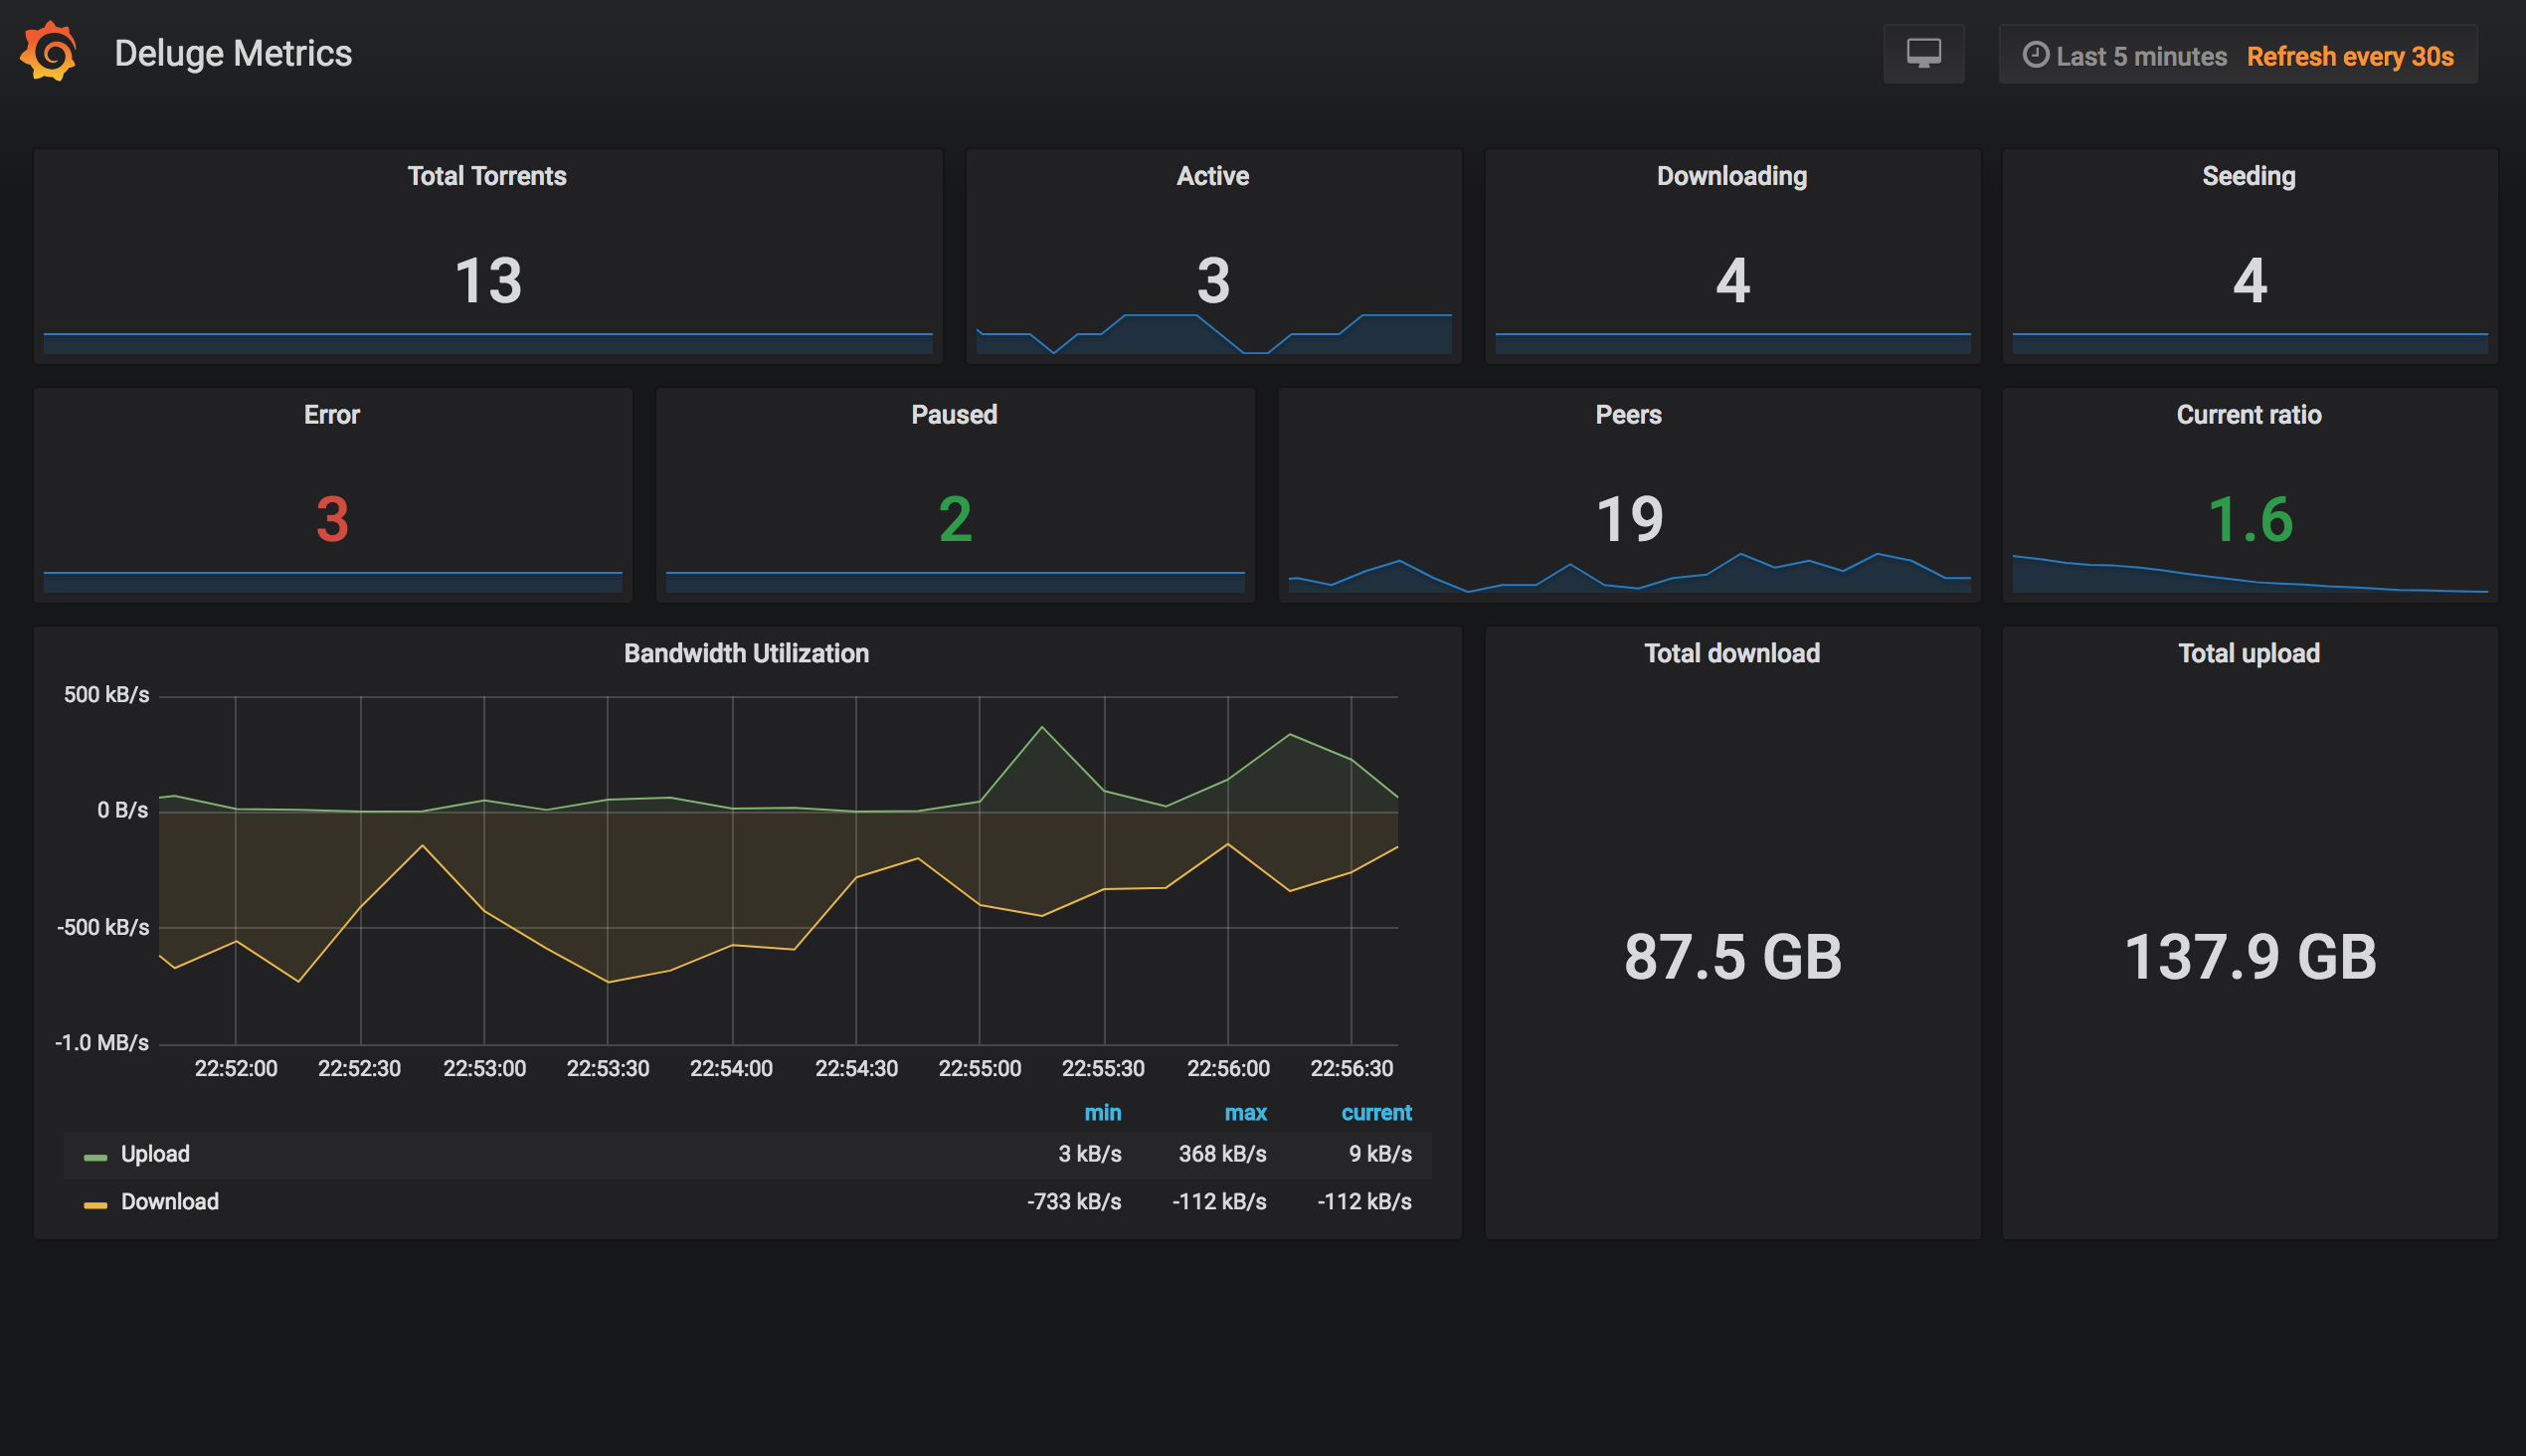
Deluge Dashboard is a very simple way to display Deluge torrent metrics. It uses the deluge exporter to populate a Prometheus data source. The panels in this dashboard can be copied into more comprehensive dashboards for a single pane of glass view of your network transfers or it can be used as a standalone glanceboard.
You can install the dashboard from the Grafana website or from my repo.


